
EMI3News & insightProduct
Inside the limits, and still going wrong
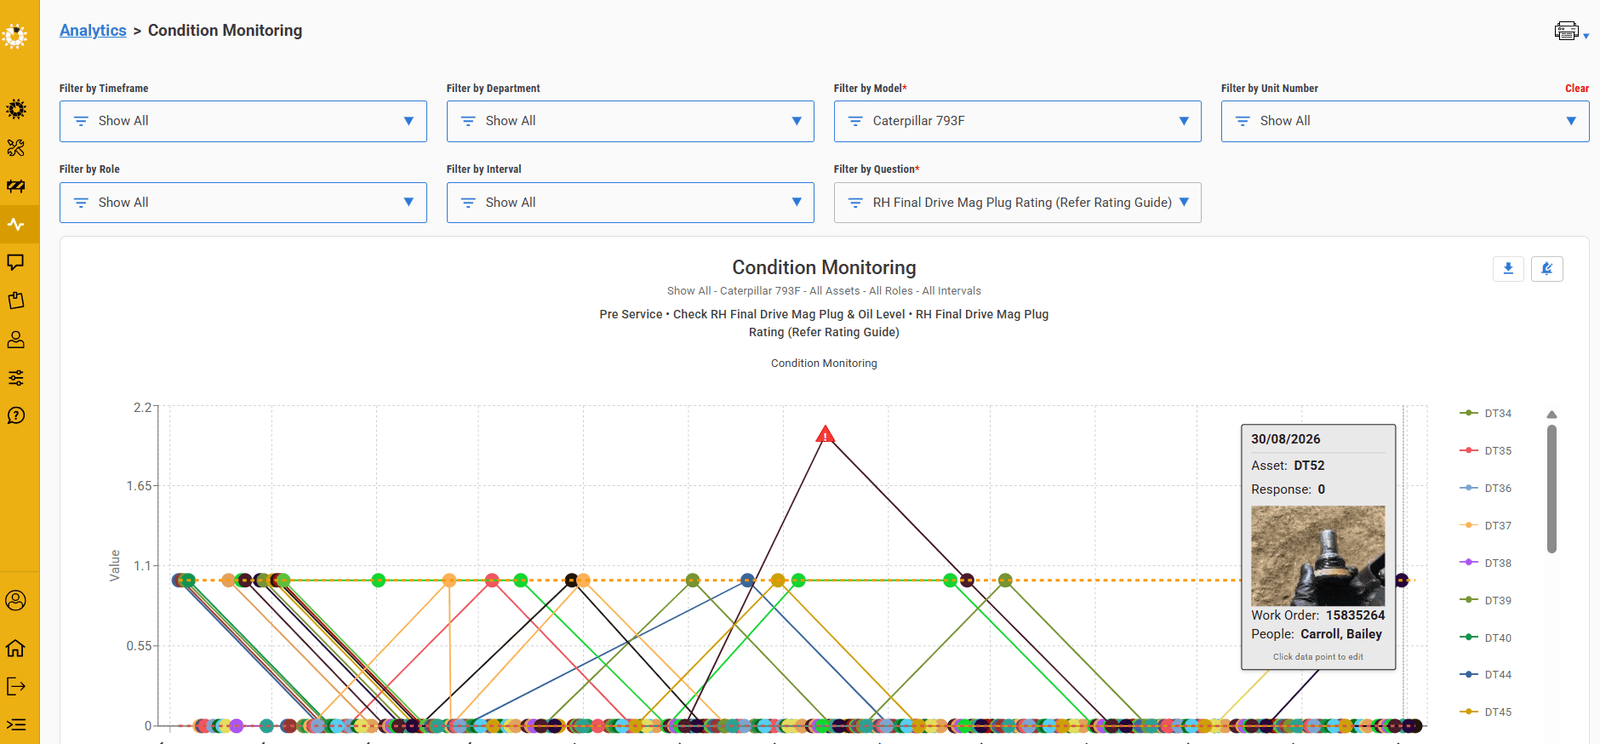
A condition monitoring question captures a number and a photograph. The platform trends it across the fleet, watches the rate of change, and raises an alert while the reading is still comfortably inside its limits.
Most condition monitoring is built on thresholds. Set a minimum, set a maximum, and raise something when a reading falls outside them. It works, and it is also the reason a lot of failures arrive as a surprise, because a threshold can only tell you that you have already crossed it.
What it cannot tell you is that a value which sat at the same number for eleven services has just moved sharply, and is still well inside spec.
A reading can be perfectly within limits and still be the most alarming thing on the machine that week.
One question, three jobs
The example in the chart above is an ordinary pre-service question on a fleet of Caterpillar 793F haul trucks: RH Final Drive Mag Plug Rating, answered against a rating guide. Nothing exotic. What makes it useful is that the single question is doing three things at once.
- It records a value. A Number-type response, captured at the machine as part of the service, not typed into a spreadsheet afterwards.
- It captures an image. Enabling Capture an Image on the question puts a camera icon in front of the technician. One photograph is stored against that response. No defect has to be raised for the picture to exist.
- It feeds a trend. Every response lands in Condition Monitoring analytics, filterable by model, unit, role, interval and question. One plug rating becomes a line per asset across the whole fleet.
The alert watches the movement, not the number
The rate-of-change alert is configured on the question itself. You choose whether the threshold is a Percentage or an Absolute value, set an Above and a Below figure, and write the message the technician should see. It then compares each new reading against what came before.
When the movement exceeds what you said was normal, two things happen. An alert icon appears on the chart in Condition Monitoring analytics: the red marker on the spike above. And at the point of entry, on the iPad, a popup puts the values in front of the technician along with the action being requested, which they must acknowledge or cancel.
That second part matters more than it looks. The alert does not wait for someone to open a dashboard next Tuesday. It interrupts the person standing at the machine, while the machine is still open, and their response (acknowledged or dismissed) is recorded in the analytics and on the service report.
Why the photograph changes the conversation
A number on its own is ambiguous. A mag plug rated 2 means one thing to the fitter who rated it and something slightly different to the reliability engineer reading it four months later.
Because the image is attached to the response, hovering a point on the trend shows the photograph taken at that reading, and clicking expands it. The reviewer is no longer interpreting a digit. They are looking at the debris on the plug, on that date, on that unit, recorded by that person against that work order.
The trend tells you something moved. The photograph tells you what it looked like when it did.
What the combination is actually worth
Individually these are modest features. A number field. A camera. A chart. A threshold rule. Together they close a loop that is usually open in industrial maintenance:
- The observation is structured, so it can be compared across a fleet rather than living in a comment box.
- The movement is watched automatically, so an early signal does not depend on someone noticing a pattern across eleven separate reports.
- The alert lands where the work is, not in a weekly review, so it can change what happens on that shift.
- The evidence is already attached, so the decision to pull a machine (or leave it running) can be defended months later without a hunt.
That is the difference between condition data and condition monitoring. One is a record of what you measured. The other tells you when to pay attention, and shows you why.
Was this useful?
We read every response. It decides what we write next.
We will not add you to a mailing list.
Keep reading
Insight
Your CMMS is not the execution layer
Enterprise systems hold the asset record. Planning systems schedule the work. Neither of them sees the work being performed, and that gap is not a reporting problem to be fixed with another dashboard.
12 August 2026 · 8 min read
Insight
Chaos, constrained: why maintenance behaves like a complex system
Small deviations at the start of a shift produce very large differences by the end of it. You cannot remove that sensitivity, but you can bound it, the way aviation and surgical systems do.
29 July 2026 · 6 min read
Insight
Work deconstruction, not process abstraction
Most vendors digitise the description of the work. Taking the task apart at the machine produces something quite different, and it is why field adoption behaves the way it does.
15 July 2026 · 7 min read